Worldwide Covid Infection and Fatality Stats
All stats retrieved 01-12-2025.
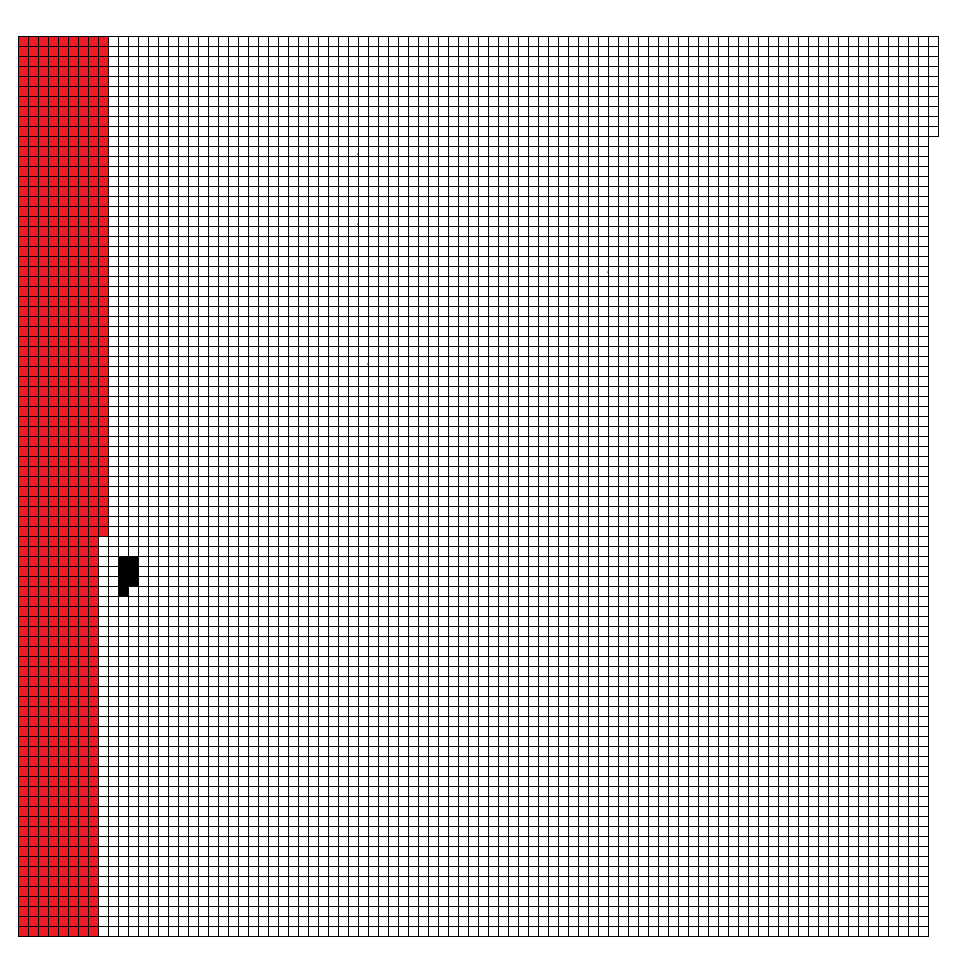
(refer to the graphic below)
Each of these 8200 squares represents
1 million people and the graphic as a
whole represents the estimated human
population of Earth on 01-12-2024 which
was just under 8.2 billion.
The grid is (91 x 90) + 10
The 777 red and black squares represent the
777,126,421 million reported cases of covid worldwide.
The 7 black squares represent the reported
7,079,925 people who sadly have died from
covid 19 since the beginning of the pandemic.
Worldwide, that amounts to about one in
every 1158 people. |